User Events Dashboards
export const meta = { title: 'User Events dashboards', description: 'Create persistent User Events dashboards from saved SQL result cards, organize them on a grid, and refresh reusable reports.', tags: ['reference'], };
User Events dashboards let you turn SQL query results from Explore into reusable dashboard cards. Use them to save recurring analysis, organize multiple result cards in one view, and reopen dashboards later with fresh data.
01When to use User Events dashboards
Use User Events dashboards when you want to move from one-off exploration to repeatable reporting. They work well when you need to share a consistent view of user event trends, keep related queries together, or revisit the same analysis without rebuilding each query from scratch.
Common use cases include:
- Tracking recurring user event metrics in a single dashboard
- Saving useful SQL results from Explore so you can return to them later
- Comparing multiple event queries side by side
- Building a dashboard layout that supports regular review or investigation
02Core concepts
User Events dashboards are built from saved query results. You create or open a dashboard, add result cards from Explore, arrange cards on a grid, and update cards as your reporting needs change.
Explore results and saved cards
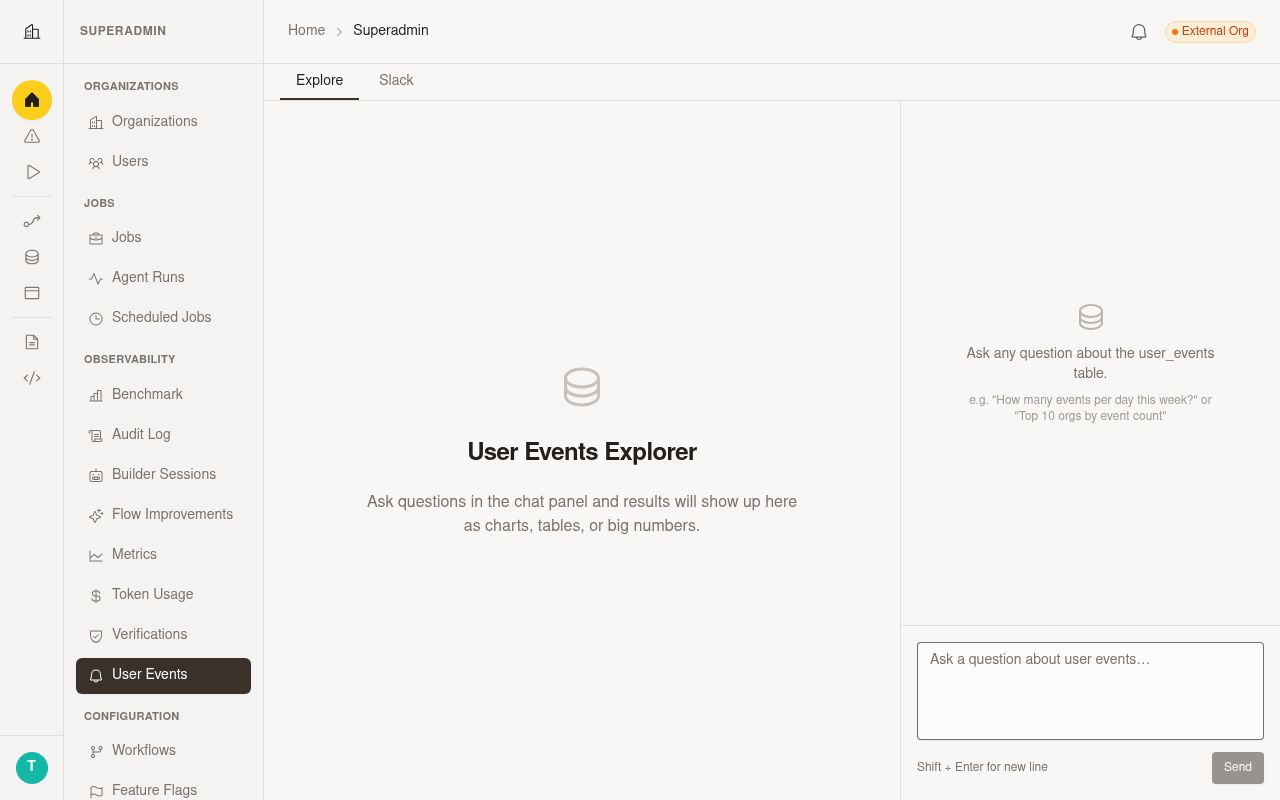
In Explore, you write and run a SQL query against User Events data. When a result is useful enough to keep, save that result as a dashboard card instead of rerunning the same analysis from scratch every time.
A saved card keeps the query and its presentation together so you can reopen it in a dashboard later. This workflow helps you turn ad hoc analysis into a reusable reporting asset.
Dashboards and dashboard cards
A dashboard is a persistent container for saved result cards. Each dashboard card represents one saved query result and displays it with a supported visualization.
You can add multiple cards to the same dashboard, resize them, and move them around the grid to create a layout that matches the way you review data.
Supported visualization types
User Events dashboards support the visualization types available when saving and editing result cards from Explore.
| Visualization type | Description |
|---|---|
table | Show raw query results in a tabular format. Best for detailed inspection and flexible result sets. |
bar | Compare values across categories or grouped results. |
line | Show change over time for time-based query results. |
area | Highlight trends over time with filled series. |
pie | Show relative proportions for a small set of grouped values. |
stat | Highlight a single key value from a result set. |
The exact visual output depends on your query shape and the data keys you choose in the card settings.
03Create and manage dashboards
Create a dashboard when you want a persistent place to collect saved query results. After you create it, you can reopen it from its URL-driven state, update its name, or remove it if you no longer need it.
Create a new dashboard
- Open User Events and go to Dashboards.
- Click New dashboard.
- Enter a dashboard name.
- Save the dashboard.
After you save the dashboard, open it to start adding cards from Explore.
Open, rename, and delete dashboards
Open a dashboard from the dashboards list or by returning to its URL. The dashboard restores its saved state so you can continue reviewing or editing the same set of cards.
Use the dashboard actions to rename or delete a dashboard:
- Open the dashboard you want to manage.
- Open the dashboard action menu.
- Click Rename to update the title, or click Delete to remove the dashboard.
- Confirm the change.
Delete a dashboard only when you no longer need its saved layout and cards. If you want to preserve reporting history, rename and continue updating the existing dashboard instead.
04Save query results to a dashboard
Save query results from Explore when you want to keep a query and its visualization in a reusable dashboard view. You can save to a new dashboard or add the result to an existing one.
Save to a new dashboard
- Open User Events and go to Explore.
- Enter and run your SQL query.
- Configure the result visualization.
- Click Save to dashboard.
- Choose New dashboard.
- Enter a dashboard name and card name.
- Save your changes.
Use this path when the result starts a new reporting workflow or deserves its own dedicated dashboard.
Add a result card to an existing dashboard
- Open Explore and run the query you want to save.
- Review the result and confirm the visualization settings.
- Click Save to dashboard.
- Choose an existing dashboard.
- Enter or confirm the card name.
- Save the card.
Use this path when the new result belongs with related cards you already review together.
05Edit dashboard cards
Edit dashboard cards when you need to refine a query, change how the result is displayed, or improve the dashboard layout. Saved cards support SQL previews, visualization changes, and layout adjustments.
Update SQL and run previews
Open a saved card in edit mode to update its SQL. Use the preview flow to validate the result before saving the change back to the dashboard.
- Open the dashboard.
- Select the card you want to edit.
- Click Edit.
- Update the SQL query.
- Click Run preview.
- Review the previewed result.
- Save the card.
Preview changes before saving so you can confirm the query still returns the data shape your visualization expects.
Change visualization settings and data keys
After previewing the result, adjust the visualization to better communicate the data. Select the visualization type, then choose the relevant data keys for axes, series, labels, or values.
Use data keys that match the purpose of the card:
- Choose time-based keys for trend charts
- Choose grouped category keys for comparison charts
- Choose a single summary value for stat cards
- Use a table when the result needs full detail instead of a summary view
If the chart does not render the way you expect, rerun the preview and confirm that your selected keys match the query output.
Resize and rearrange cards
Use the dashboard grid to organize cards by importance and reading order. Resize larger charts so trends are easy to read, and keep smaller summary cards near the top for quick scanning.
To update the layout:
- Open the dashboard.
- Drag a card to a new position on the grid.
- Resize the card using its layout handles.
- Continue adjusting until the layout supports the way you review data.
Group related cards together so the dashboard is easier to scan and interpret.
06Refresh dashboard data
Refresh dashboard data when you want the latest results for the saved cards in the current layout. Refresh reruns the saved card queries and updates the dashboard with current data.
Use refresh when:
- You are reviewing a dashboard that you have not opened recently
- The underlying event data may have changed since the last run
- You have updated a card and want the dashboard to reflect the newest result set
If a card shows unexpected output after a refresh, open the card editor and run a preview to confirm the query and visualization settings still match.
07Permissions and access
User Events dashboards are available only to superadmins. If you do not have superadmin access, you cannot create dashboards, save result cards, or edit dashboard layouts.
If you expect to use this workflow and the dashboard actions are not available, ask a superadmin to confirm your access level.
08Best practices
- Start in Explore, then save only the queries you expect to reuse
- Keep each dashboard focused on a single team, question, or review workflow
- Use clear card names so you can quickly understand what each result shows
- Prefer simple visualizations that match the query output
- Preview SQL changes before saving them to a shared dashboard
- Place the most important cards near the top-left of the grid
- Refresh dashboards before making decisions based on saved results